

Data Analysis of Women Empowerment in Pakistan

CHAPTER 4
DATA ANALYSIS
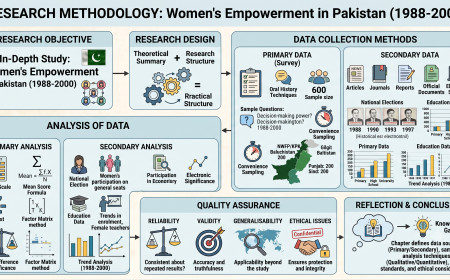
The analysis of the data was carried out by adopting the following procedure:
* Statement Analysis
* Analysis Based on Mean Scores
* Pearson Measurement
* Significance of Sex Differences
* Analysis of Scale Factors (Factor-Matrix)
* Analysis of Women’s Participation in General Elections (1988-2000)
* Analysis of Women Empowerment in Education (1988-2000)
The data gathered through questionnaire of 600 respondents from all the provinces and the administrative areas of Pakistan have been analyzed here. The sample included 197 participants from Punjab province100 participants each from Sindh, Baluchistan, Khyber Pakhtunkhwa and Gilgit Baltistan. First of all the analysis would be done for all over the Pakistan collectively and then correlation of provinces will be done.
4.1 Statement Analysis
The questionnaire consisted of 46 questions out of which 13 questions were self-explanatory and 33 questions were specifically about the women empowerment during the period 1988-2000. Last question was about the suggestion about the empowerment of women in Pakistan but there was no response from population about it. Here are the responses of the subjects along with discussion thereof.
Figure 4.1 - What is your Gender?
In the selected sample, there were 57% females and 43% males. Male respondents were included in the sample so that the views of male and female subjects could be compared for an unbiased conclusion.
Figure 4.2 - What is Your Age?
In the selected sample majority was between 30 to 45+ years of age. This cohort had firsthand knowledge of the conditions prevailing during the era under study. The younger generation (20 -30 years) was included in the sample to obtain vies of the younger generation about the women empowerment.
Figure 4.3 - What is your marital status?
Majority of the subjects were married. Married respondents were 78 % and 22 % were unmarried.
Figure 4.4 - What is your employment status?
Most of the subjects were working as private employees and lesser number was self-employed and a small number was household class. In the sample, 17 % were house hold and 30 % were self-employed, 31 % were working in private sector and 22 % were working in government sector.
Figure 4.5 - What is your education?
Majority of the respondents were matriculate and above. 11% of the subjects were Primary pass, 6% were below Matric, 12% were Matriculates, 34% were Graduates, and 47% were Post- Graduates.
Figure 4.6 – The women of 1988-2000 felt easy in society?
Here by the data this is clear that still in this advance era most of the women were not comfortable while they are performing different roles in the Pakistani society. There are generally some hurdles for the women in the practical fields all over the world but in Pakistan case is a little different as here women have to face a lot of problems when they try to work side by side with men. They have to face a lot of bounds and they even don’t feel safe while moving in the society. This is the darker side of society and this is the main hurdle in all the areas of progress and empowerment of women. In the data 8 % of the total sample told that they felt easy in the society but 29 % of the sample told that they did not feel easy in the society. 63 % of the sample told that they had no idea about it. It means that they did not easy in the society too. So, large majority was feeling not easy in the society. It is also a strange and complex situation that 63 percent of the women said that they did not know whether they were comfortable or not in the society. This means that they had no time and space to analyze the situation about their living environment or they did not have the courage or liberty to say something about it. So in this situation, they may be included in the women who were not comfortable in the society. So a large majority of the women felt uncomfortable in the society.
Figure 4.7 – Society gave respect to women in 1988-2000?
This is again not a satisfactory conditions where almost two third of women thought that the society was not giving them the proper respect that they deserved. This is the case for the entire domestic and the practical women as they are treated like the grade 2 citizens. On the workplaces they are treated very badly and sometimes male colleagues try to exploit them in different ways as well. In this situation their proper participation to the progress of country is not possible and their proper empowerment is out of question. 23 % of the total sample told that the society gave them respect but 32 % of the sample said that they did not feel respect in the society. 45 % of the sample told that they had no idea about the respect in the society. It means that these 45 % also were not feeling comfortable in the society with reference to the respect.
Figure 4.8 – The Women in 1988-2000 felt safe in society?
Here is again unsatisfactory condition where more than half of the females felt themselves insecure and were not feeling safe in this society. In fact all the working class is almost insecure as they have to face different types of problems and threats by the male members of society. On domestic level some of the household ladies are also feeling the same conditions as they are being physically tortured by their husbands for different reasons. So if a person is not even feeling secure and safe then the idea of having power is out of scope. In this data 26 % of the total sample told that they felt safe in the society. 30 % of the total sample told that they did not feel safe in the society and 44 % of the total sample said that they had no idea. The large number of sample told that they had no idea whether they were safe in the society or not. It means that they hesitated to tell the situation of the society. So, large number of sample thought that they were not safe in the society in that era.
Figure 4.9 – you know at least one incident of violence against women during 1988-2000?
Majority of the selected sample is well aware of the term violence against women so the results can be called as the accurate as people are well aware of the questions they are being asked. 79% of the total sample told that they were well aware about the violence against women, 12% of the sample said that they did not know about the violence against women and 9 % of the sample told that they had no idea about said violence.
Figure 4.10 – If you are married women, you ever faced an incident of domestic violence during 1988-2000?
In the total sample 319 persons responded as they were married women in the total sample and they also had idea about the domestic violence. In the selected sample a very less number of women had faced domestic violence. This is due to the selection of well-educated people for the collection of data. On the other hand, if we had selected the illiterate personals for the collection of date this percentage can be too huge.
Figure 4.11 - The women of 1988-2000 knew the rights and obligations guaranteed by religion?
Due to the selection of well-educated sample for better results almost half of the personals had the opinion that the women of the said era were well aware of the right and obligations that had been provided by the religion. 49% of the total sample told that the women knew about the rights and obligations guaranteed by the religion. Only 7% told that they had no idea about it. But 44% of the sample also told that they had no idea about it. It means that they just avoided or mixed up the rights and obligations, or they had no clear picture about it.
Figure 4.12 - Were you in favour of working of women outside home in 1988-2000?
|
Figure 4.13 - Do you felt purdah was hindrance in women development in 1988-2000? |
Figure 4.13 - Do you felt purdah was hindrance in women development in 1988-2000?
Majority of the participants did not consider veil was the hindrance in the way of working women. They thought that the women with veil could perform well in the field like the other women. 16 % of the total sample said that they thought that purdah was a hindrance in women development; the majority (77 %) said that they did not think that veil was a hindrance in development of women and 7 % of the total sample told that they had no idea about it. It means that the majority is not against the veil and not considering it as a hurdle for development. In the west, it is an established concept that the veil is a big hindrance in women development and many of organization even the governments are working against the veil. But responses here show that in Pakistan the situation is quite different and even women do not think that the purdah is creating any problem for their development. Anyhow it is important that in this survey the type of purdah is not discussed. We know the concept of purdah is different in the different societies and it varies from area to area and time to time. It has different definitions and concepts in different areas, but here we have discussed and gathered data on general concept. About this question also, some respondents said that they had no idea. It means that the number of sample have no exact idea about it. This is why that the male members have no exact idea about it because they do not have the direct experience of veil and they only have the idea based on women observation. It also varies about the work and veil relationship. In some works veil seems to be the big hurdles and in some works it seems no problem. So the contribution of women in various fields in Pakistan also varies from time to time and space to space.
In the next Statement Analysis, mean score was calculated by using the following formula:
Mean Score = F.SA x 5+F.A x 4+F.U x 3+F.D x 2+F.SD x 1/N (Number of Sample)
Table 4.1 Participation of women in national assembly.
|
Statement |
Levels |
Frequency |
%age |
Mean score |
|
The level of participation of women in national assembly was satisfactory in this era. |
A SA D SD U |
69 94 269 63 102 |
12% 16% 45% 10% 17% |
2.76 |
|
|
|
N=597 |
100% |
|
Table 4.14 indicates that 28% respondents agreed to the statement, 17% were undecided while 55% of the respondents showed disagreement. Mean score was 2.76 (less than 3.00) which indicates that majority of the participants did not agree that the representation of women in national assembly was satisfactory in that era.
Fig 4.14 Participation of women
Table 4.2 Women representation according to the desired ratio.
|
Statement |
Levels |
Frequency |
%age |
Mean score |
|
The women representation in the national assembly was according to the required ratio in this era. |
A SA D SD U |
45 79 293 71 109 |
8% 13% 49% 12% 18% |
2.61 |
|
|
|
N=597 |
100% |
|
Table 4.15 shows that 21% respondents agreed to the statement, 18% were undecided while 61% of the respondents showed disagreement. Mean score was 2.61 (less than 3.00) which indicates that the majority of the participants did not agree that the representation of women in national assembly was according to the required ratio in that era.
Fig 4.15 Representation of women according to ratio
Table 4.3 Women representation in provincial assemblies.
|
Statement |
Levels |
Frequency |
%age |
Mean score |
|
The women representation in the provincial assemblies was according to the required ratio in this era. |
A SA D SD U |
33 56 278 54 176 |
6% 10% 46% 9% 29% |
2.59 |
|
|
|
N=597 |
100% |
|
Table 4.16 reflects that 16% respondents agreed to the statement, 29% were undecided while 54% of the respondents showed disagreement. Mean score was 2.59 (Less than 3.00) which indicates that the majority of the participants did not agree that the representation of women in provincial assemblies was according to the required ratio in that era.
Fig. 4.16 Women representation in provincial assemblies
Table 4.4 Participation of women in decision making.
|
Statement |
Levels |
Frequency |
%age |
Mean score |
|
The level of participation of women in decision making process was satisfactory. |
A SA D SD U |
43 48 265 53 188 |
7% 8% 44% 9% 31% |
2.61 |
|
|
|
N=597 |
100% |
|
Table 4.17 shows that 15% respondents agreed to the statement, 31% were undecided while 53% of the respondents showed disagreement. Mean score was 2.61 (Less than 3.00) which indicates that the majority of the participants were not agreed that the participation of women in decision making process was satisfactory.
Fig. 4.17 Participation of women in decision making process.
Table 4.5 Women participation in Primary politics
|
Statement |
Levels |
Frequency |
%age |
Mean score |
|
Primary responsibilities of politics were being fulfilled by the women in this era. |
A SA D SD U |
53 102 227 67 148 |
9% 17% 40% 11% 25% |
2.15 |
|
|
|
N=597 |
100% |
|
Table 4.18 reflects that 26% respondents agreed to the statement, 25% were undecided while 51% of the respondents showed disagreement. Mean score was 2.15 (Less than 3.00) which indicates that the majority of the participants were not agreed that the primary responsibilities of politics were being fulfilled by the women in that era.
Fig. 4.18 Women share in Primary responsibilities.
Table 4.6 Women Role in Politics was dummy or Active.
|
Statement |
Levels |
Frequency |
%age |
Mean score |
|
Women played active role in politics in this era rather than just a dummy character. |
A SA D SD U |
75 99 206 116 101 |
13% 17% 34% 19% 17% |
2.72 |
|
|
|
N=597 |
100% |
|
Table 4.19 shows that 30% respondents agreed to the statement, 17% were undecided while 53% of the respondents showed disagreement. Mean score was 2.72 (Less than 3.00) which indicates that the majority of the participants were not agreed that the women was playing active role in the politics in that era, mean women were playing a dummy role in politics.
Fig. 4.19 Women role in politics were dummy or active.
Table 4.7 Land Rights of Women
|
Statement |
Levels |
Frequency |
%age |
Mean score |
|
Women were given full rights of land inheritance and were authorized to use this according to their will. |
A SA D SD U |
29 19 221 257 71 |
5% 3% 37% 43% 12% |
1.54 |
|
|
|
N=597 |
100% |
|
Table 4.20 reflects that 8% respondents agreed to the statement, 12% were undecided while 80% of the respondents showed disagreement. Mean score was 1.54 (Less than 3.00) which indicates that the big majority of the participants were not agreed that the women were given full rights of land inheritance and they were also not authorized to use them according to their will.
Fig 4.20 Women rights of land inheritance.
Table 4.8 Share in food and basic necessities of women.
|
Statement |
Levels |
Frequency |
%age |
Mean score |
|
Women were provided full facilities of food and other basic necessities of life in your area in this era. |
A SA D SD U |
152 180 82 42 141 |
25% 30% 14% 7% 24% |
3.57 |
|
|
|
N=597 |
100% |
|
Table 4.21 shows that 55% respondents agreed to the statement, 24% were undecided while 21% of the respondents showed disagreement. Mean score was 3.57 (More than 3.00) which indicates that the majority of the participants were agreed that the women were provided full facilities of food and other facilities of life in that era.
Fig. 4.21 Basic facilities for women.
Table 4.9 Women authority in the field of agriculture.
|
Statement |
Levels |
Frequency |
%age |
Mean score |
|
Women were authorized to exercise power in the field of agriculture rather than just working as labour. |
A SA D SD U |
0 0 166 364 67 |
0% 0% 28% 61% 11% |
1.50 |
|
|
|
N=597 |
100% |
|
Table 4.22 reflects that 0% respondents agreed to the statement, 11% were undecided while 89% of the respondents showed disagreement. Mean score was 1.50 (Less than 3.00) which indicates that the big majority of the participants were not agreed that the women were authorized to exercise proper power in the field of agriculture, they agreed that the women were working just as a labour in that era.
Fig. 4.22 Women authority in the field of agriculture.
Table 4.10 women wages in industries.
|
Statement |
Levels |
Frequency |
%age |
Mean score |
|
Wages in the industries were on satisfactory level for women in this era. |
A SA D SD U |
25 51 237 184 100 |
4% 8% 40% 31% 17% |
2.19 |
|
|
|
N=597 |
100% |
|
Table 4.23 reflects that 12% respondents agreed to the statement, 17% were undecided while 71% of the respondents showed disagreement. Mean score was 2.19 (Less than 3.00) which indicates that the majority of the participants were not agreed that the wages of women in industries were on satisfactory level in that era.
Fig. 4.23 Wages of women in industries.
Table 4.11 Women opportunities in jobs.
|
Statement |
Levels |
Frequency |
%age |
Mean score |
|
Women had equal opportunities for the entry in any of the job field. |
A SA D SD U |
25 50 185 258 79 |
4% 8% 32% 43% 13% |
2.03 |
|
|
|
N=597 |
100% |
|
Table 4.24 shows that 12% respondents agreed to the statement, 13% were undecided while 75% of the respondents showed disagreement. Mean score was 2.03 (Less than 3.00) which indicates that the majority of the participants were not agreed that the women had equal opportunities for the entry in any of the job field.
Fig. 4.24 Job opportunities for women.
Table 4.12 Women authority in labour force.
|
Statement |
Levels |
Frequency |
%age |
Mean score |
|
Women had proper authority without any biasness in the labour force. |
A SA D SD U |
15 6 167 315 94 |
2% 1% 28% 53% 16% |
1.71 |
|
|
|
N=597 |
100% |
|
Table 4.25 reflects that 3% respondents agreed to the statement, 16% were undecided while 81% of the respondents showed disagreement. Mean score was 1.71 (Less than 3.00) which indicates that the big majority of the participants were not agreed that the women had proper authority in the labour force.
Fig. 4.25 Women authority in labour force.
Table 4.13 Working environment for women
|
Statement |
Levels |
Frequency |
%age |
Mean score |
|
The working environment for women in this era was satisfactory and encouraging. |
A SA D SD U |
29 48 172 184 164 |
5% 8% 29% 31% 27% |
2.30 |
|
|
|
N=597 |
100% |
|
Table 4.26 shows that 13% respondents agreed to the statement, 27% were undecided while 60% of the respondents showed disagreement. Mean score was 2.30 (Less than 3.00) which indicates that the majority of the participants were not agreed that the working environment for women in this era was satisfactory and encouraging.
Fig.4.26 working environment for women.
Table 4.14 Women authority in labour union
|
Statement |
Levels |
Frequency |
%age |
Mean score |
|
Women had proper authority in the labour union in this era. |
A SA D SD U |
0 0 239 244 110 |
0% 0% 40% 41% 19% |
1.78 |
|
|
|
N=597 |
100% |
|
Table 4.27 reflects that 0% respondents agreed to the statement, 19% were undecided while 81% of the respondents showed disagreement. Mean score was 1.78 (Less than 3.00) which indicates that the big majority of the participants were not agreed that the women had proper authority in the labour union in that era.
Fig. 4.27 Women authority in labour union
Table 4.15 Women role in reduction of poverty
|
Statement |
Levels |
Frequency |
%age |
Mean score |
|
Women played equal role in reduction of poverty in this era. |
A SA D SD U |
214 161 78 44 100 |
36% 27% 13% 7% 17% |
3.61 |
|
|
|
N=597 |
100% |
|
Table 4.28 shows that 63% respondents agreed to the statement, 17% were undecided while 20% of the respondents showed disagreement. Mean score was 3.61 (More than 3.00) which indicates that the majority of the participants were agreed that women played equal role in the reduction of poverty in this era while 20% think that women did not play the equal role.
Fig. 4.28 Women role in poverty reduction
Table 4.16 Govt. initiative for women economic empowerment
|
Statement |
Levels |
Frequency |
%age |
Mean score |
|
The initiatives taken by the Government in that era for economic empowerment of women was satisfactory. |
A SA D SD U |
153 57 140 97 150 |
26% 10% 23% 16% 25% |
2.88 |
|
|
|
N=597 |
100% |
|
Table 4.29 reflects that 36% respondents agreed to the statement, 25% were undecided while 39% of the respondents showed disagreement. Mean score was 2.88 (Less than 3.00) which indicates that the majority of the participants were not agreed that the initiative taken by the government for economic empowerment of women was satisfactory in that era.
Fig. 4.29 Government initiative for women economic empowerment.
Table 4.17 Initiatives of NGOs for economic empowerment of women
|
Statement |
Levels |
Frequency |
%age |
Mean score |
|
The initiatives taken by the NGOs in that era for economic empowerment of women were satisfactory. |
A SA D SD U |
53 144 159 114 127 |
9% 24% 27% 19% 21% |
2.92 |
|
|
|
N=597 |
100% |
|
Table 4.30 shows that 33% respondents agreed to the statement, 21% were undecided while 46% of the respondents showed disagreement. Mean score was 2.92 (Less than 3.00) which indicates that the majority of the participants were not agreed that the initiatives taken by the NGOs in that era for economic empowerment of women were satisfactory.
Fig. 4.30 Initiative of NGOs for women economic empowerment.
Table 4.18 Opportunity of education for women
|
Statement |
Levels |
Frequency |
%age |
Mean score |
|
Women were provided with equal opportunities of education in this era. |
A SA D SD U |
214 150 130 74 29 |
36% 25% 22% 12% 5% |
3.39 |
|
|
|
N=597 |
100% |
|
Table 4.31 shows that 61% respondents agreed to the statement, 5% were undecided while 34% of the respondents showed disagreement. Mean score was 3.39 (More than 3.00) which indicates that the majority of the participants were agreed that women were provided with equal opportunities of education in that era.
Fig. 4.31 Education opportunities for women
Table 4.19 Literacy Rate of women
|
Statement |
Levels |
Frequency |
%age |
Mean score |
|
Overall literacy rate of women had increasing trend in this era. |
A SA D SD U |
309 131 39 35 83 |
52% 22% 6% 6% 14% |
3.77 |
|
|
|
N=597 |
100% |
|
Table 4.32 shows that 74% respondents agreed to the statement, 14% were undecided while 12% of the respondents showed disagreement. Mean score was 3.77 (More than 3.00) which indicates that the majority of the participants were agreed that overall literacy rate of women had increasing trend in that era.
Fig. 4.32 Women role in poverty reduction
Table 4.20 Enrollment of women in education
|
Statement |
Levels |
Frequency |
%age |
Mean score |
|
Enrollment of women in education was satisfactory in this era. |
A SA D SD U |
103 66 251 80 97 |
17% 11% 42% 14% 16% |
2.70 |
|
|
|
N=597 |
100% |
|
Table 4.33 shows that 28% respondents agreed to the statement, 16% were undecided while 53% of the respondents showed disagreement. Mean score was 2.70 (Less than 3.00) which indicates that the majority of the participants were not agreed that the enrollment of women in education was satisfactory in that era.
Fig. 4.33 Women enrollment in education
Table 4.21 Education facilities for women on school level
|
Statement |
Levels |
Frequency |
%age |
Mean score |
|
Education facilities for women on school level were satisfactory in this era. |
A SA D SD U |
164 107 179 103 44 |
28% 18% 30% 17% 7% |
2.98 |
|
|
|
N=597 |
100% |
|
Table 4.34 reflects that 46% respondents agreed to the statement, 7% were undecided while 47% of the respondents showed disagreement. Mean score was 2.98 (Less than 3.00) which indicates that the majority of the participants were not agreed that the education facilities for women on school level were satisfactory in that era.
Fig. 4.34 Education facilities for women on school level.
Table 4.22 Education facilities for women on college and university level.
|
Statement |
Levels |
Frequency |
%age |
Mean score |
|
Education facilities for women on college and university level were satisfactory in this era. |
A SA D SD U |
101 106 247 85 58 |
17% 18% 41% 14% 10% |
2.82 |
|
|
|
N=597 |
100% |
|
Table 4.35 shows that 35% respondents agreed to the statement, 10% were undecided while 55% of the respondents showed disagreement. Mean score was 2.82 (Less than 3.00) which indicates that the majority of the participants were not agreed that the education facilities for women on college and university level were satisfactory in that era.
Fig. 4.35 Facilities of education on college and university level for women.
Table 4.23 Education facilities for women in rural areas.
|
Statement |
Levels |
Frequency |
%age |
Mean score |
|
Women were provided with required education facilities in rural areas in this era. |
A SA D SD U |
18 27 285 177 90 |
3% 4% 48% 30% 15% |
2.05 |
|
|
|
N=597 |
100% |
|
Table 4.36 reflects that 7% respondents agreed to the statement, 15% were undecided while 78% of the respondents showed disagreement. Mean score was 2.05 (Less than 3.00) which indicates that the majority of the participants were not agreed that the education facilities for women in rural areas were satisfactory in that era.
Fig. 4.36 Education facilities for women in rural areas.
Table 4.24 Proper health facilities for women
|
Statement |
Levels |
Frequency |
%age |
Mean score |
|
Women were provided with proper health facilities in this era. |
A SA D SD U |
136 146 107 111 97 |
23% 24% 18% 19% 16% |
3.16 |
|
|
|
N=597 |
100% |
|
Table 4.37 shows that 47% respondents agreed to the statement, 16% were undecided while 37% of the respondents showed disagreement. Mean score was 3.16 (More than 3.00) which indicates that the majority of the participants were agreed that women were provided with proper health facilities in this era, however 37% think that the health facilities was not proper.
Fig. 4.37 Proper health facilities for women
Table 4.25 Women approach to health facilities.
|
Statement |
Levels |
Frequency |
%age |
Mean score |
|
Women were able to avail basic health facilities in this era. |
A SA D SD U |
134 108 207 94 54 |
22% 18% 35% 16% 9% |
2.92 |
|
|
|
N=597 |
100% |
|
Table 4.38 reflects that 40% respondents agreed to the statement, 9% were undecided while 51% of the respondents showed disagreement. Mean score was 2.92 (Less than 3.00) which indicates that the majority of the participants were not agreed that women were able to avail the basic health facilities in that era.
Fig. 4.38 Education facilities for women in rural areas.
Table 4.26 Women authority in household issues.
|
Statement |
Levels |
Frequency |
%age |
Mean score |
|
Women were authorized to take part in decision making in house hold issues in this era. |
A SA D SD U |
79 48 311 112 47 |
13% 8% 52% 19% 8% |
2.39 |
|
|
|
N=597 |
100% |
|
Table 4.39 reflects that 21% respondents agreed to the statement, 8% were undecided while 71% of the respondents showed disagreement. Mean score was 2.39 (Less than 3.00) which indicates that the majority of the participants were not agreed that women were authorized to take part in decision making in house hold issues.
Fig. 4.39 Women authority in house hold issues.
Table 4.27 Women authority in marriage decisions.
|
Statement |
Levels |
Frequency |
%age |
Mean score |
|
Women were authorized to take decisions regarding marriage in this era. |
A SA D SD U |
104 55 322 112 4 |
17% 9% 54% 19% 1% |
2.44 |
|
|
|
N=597 |
100% |
|
Table 4.40 shows that 26% respondents agreed to the statement, 1% were undecided while 73% of the respondents showed disagreement. Mean score was 2.44 (Less than 3.00) which reflects that the majority of the participants were not agreed that women were authorized to take decisions regarding marriage in that era.
Fig. 4.40 women authority in marriage decisions.
Table 4.28 Women status in the family.
|
Statement |
Levels |
Frequency |
%age |
Mean score |
|
Women were provided with the proper authority and status in family in this era. |
A SA D SD U |
173 100 179 73 72 |
29% 17% 30% 12% 12% |
3.08 |
|
|
|
N=597 |
100% |
|
Table 4.41 shows that 46% respondents agreed to the statement, 12% were undecided while 42% of the respondents showed disagreement. Mean score was 3.08 (More than 3.00) which indicates that the majority of the participants were agreed that women were provided with the proper authority and status in family in that era.
Fig. 4.41 Women status and authority in family.
Table 4.29 Women freedom of mobility
|
Statement |
Levels |
Frequency |
%age |
Mean score |
|
Women had rights, authority and freedom of mobility in the society in this era. |
A SA D SD U |
146 98 232 65 56 |
24% 17% 39% 11% 9% |
2.96 |
|
|
|
N=597 |
100% |
|
Table 4.42 shows that 41% respondents agreed to the statement, 9% were undecided while 50% of the respondents showed disagreement. Mean score was 2.96 (Less than 3.00) which reflects that the majority of the participants were not agreed that women had rights, authority and freedom of mobility in the society in that era.
Fig. 4.42 Women freedom of mobility.
Table 4.30 Role of public sector in women empowerment.
|
Statement |
Levels |
Frequency |
%age |
Mean score |
|
Public sector was working properly for the empowerment of women in this era. |
A SA D SD U |
141 94 195 93 74 |
24% 16% 33% 15% 12% |
2.91 |
|
|
|
N=597 |
100% |
|
Table 4.43 shows that 40 % respondents agreed to the statement, 12% were undecided while 48 % of the respondents showed disagreement. Mean score was 2.91 (Less than 3.00) which reflects that the majority of the participants were not agreed that the public sector was working properly for the empowerment of women in that era.
Fig. 4.43 Public sector role in women empowerment.
Table 4.31 Role of Parliament in law making for women
|
Statement |
Levels |
Frequency |
%age |
Mean score |
|
Parliament was making laws for the protection of rights of women in this era. |
A SA D SD U |
28 29 329 150 61 |
5% 5% 55% 25% 10% |
2.09 |
|
|
|
N=597 |
100% |
|
Table 4.44 shows that 10% respondents agreed to the statement, 10% were undecided while 80% of the respondents showed disagreement. Mean score was 2.09 (Less than 3.00) which reflects that the majority of the participants were not agreed that the parliament was making proper laws for the protection of this rights of women in that era.
Fig. 4.44 Role of parliament about law making of women.
Table 4.32 Working of NGOs for rights of women.
|
Statement |
Levels |
Frequency |
%age |
Mean score |
|
NGOs were properly working for the rights of women in this era. |
A SA D SD U |
32 34 309 88 134 |
5% 6% 52% 15% 22% |
2.35 |
|
|
|
N=597 |
100% |
|
Table 4.45 shows that 11% respondents agreed to the statement, 22% were undecided while 67% of the respondents showed disagreement. Mean score was 2.35 (Less than 3.00) which reflects that the majority of the participants were not agreed that the NGOs were properly working for the rights of women in that era.
Fig. 4.45 Role of NGOs for rights of women.
4.2 Analysis on the Basis of Mean Scores
When analyzing the statements the mean scores for the each statement was also calculated along with the percentage. These statements were analyzed and interpreted by the distribution of mean scores into three categories.
1. Mean-Score> 4.00
(High level of agreement)
2. Mean-Score between 3.00 and 4.00
(Moderate level of agreement)
3. Mean-Score< 3.00
(Low level of agreement)
With this set of norms all the statements were analyzed. Firstly, all the descriptive statements were tabulated in a pattern, so that the means scores should be reflected in descending order for better comparison in a quick view.
Table 4.33: Comparison of Mean Scores
|
Statement No. |
Statements |
Mean Score |
|
32 |
Overall literacy rate of women had increasing trend in that era. |
3.77 |
|
28 |
Women played equal role in reduction of poverty in that era. |
3.61 |
|
21 |
Women were provided full facilities regarding the food and other basic necessities of life. |
3.57 |
|
31 |
Women were provided with equal opportunity of education in that era. |
3.39 |
|
37 |
Women were provided with proper health facilities in that era. |
3.16 |
|
41 |
Women were provided with the proper authority and status in family in that era. |
3.08 |
|
34 |
Education facilities for women on school level were satisfactory in that era. |
2.98 |
|
42 |
Women had rights, authority and freedom of mobility in society in that era. |
2.96 |
|
30 |
The initiative taken by the NGOs in that era for the economic power of women were satisfactory. |
2.92 |
|
38 |
Women were able to avail basic health facilities in that era. |
2.92 |
|
43 |
Public sector was working properly for the empowerment of women in that era. |
2.91 |
|
35 |
Education facilities for women on college and university level were satisfactory in that era. |
2.82 |
|
14 |
The level of participation of women in national assembly was satisfactory in that era. |
2.76 |
|
19 |
Women played active role in politics rather than just a dummy character in that era. |
2.72 |
|
33 |
Enrolment of women in the education was satisfactory. |
2.70 |
|
17 |
The level of participation of women in decision making process was satisfactory in that era. |
2.61 |
|
15 |
The women representation in the national assembly was according to the required ratio in that era. |
2.61 |
|
16 |
The women representation in the provincial assembly was according to the ratio in that era. |
2.59 |
|
40 |
Women were authorized to take decision regarding marriage in that era. |
2.44 |
|
39 |
Women were authorized to take part in decision making in house hold issues in that era. |
2.39 |
|
45 |
NGOs were properly working for the rights of women in that era. |
2.35 |
|
26 |
The working environment for women in that era was satisfactory and encouraging. |
2.30 |
|
23 |
Wages in the industries were on satisfactory level for women in that era. |
2.19 |
|
18 |
Primary responsibilities of politics were being fulfilled by the women in that era. |
2.15 |
|
44 |
Parliament was making laws for the protection of the rights of women in that era. |
2.09 |
|
36 |
Women were provided with required education facilities in rural areas in that era. |
2.05 |
|
24 |
Women had equal opportunities for the entry in any of the job field. |
2.03 |
|
27 |
Women had proper authority in the labour union in that era. |
1.78 |
|
25 |
Women had proper authority without any biasness in the labour force. |
1.71 |
|
20 |
Women were given full rights of land inheritance and were authorized to use this according to their will. |
1.54 |
|
22 |
Women were authorized to exercise proper power in the field of agriculture rather than just working as labour in that era. |
1.50 |
In the numerical data in table 4.46 it is inferred that in the sample, there is no reflection of high level of agreement (mean > 4.00) on the other hand 6 (19%) showed the moderate level of agreement (mean between3.00 to 4.00), while 25 (81%), large number of sample showed disagreement with the statement. It shows that the attitude of the sample followed the negative trend. The large number of sample showed their opinion that they think the level of women empowerment was low in that era.
4.3 Person Measurement
The sample of the study is comprised on 597 persons that are collected throughout country. Among these 197 persons are from Punjab province and 100 from each province, Sindh, Baluchistan, NWFP (Now KPK). 100 persons are from the Gilgit Baltistan, the important northern area of Pakistan. So the data represent whole of the country with all areas.
The 5-point attitude scale was administered to the persons and their scores were recorded in the tabular form that is given in the Appendix C. In this data first 376 are female and last 221 are male and with the help of this score Z test was applied to assess the significance of sex difference and their approach towards the women empowerment was assessed in the said era.
This Table of Person Measurement shows that only 30(7.9%) female scored more than 96 points while only 20(9%) male scored more than 96 points. It means that the big majority of the sample is not agreed that the women were empowered in the said era. In this table the indicators showed negative trend towards the women empowerment. 32 statements about empowerment were analyzed and these 32 were multiplied by 3 the mean of attitude scale that is 96.
4.4 Significance of Sex Difference
The data 597 is comprised on 376 female and 221 male persons. Two samples were recorded separately so that Z test may be applied to assess the significance of sex difference. Mean (X) and then Standard Deviation with the formula:
was calculated.
Table 4.34 Sex wise score on the scale
|
Group |
N |
Score |
X |
SD |
|
Female |
376 |
1-376 (Table 4.47) |
60 |
19.34 |
|
Male |
221 |
377-597 (Table 4.47) |
65 |
18.70 |
To determine the significance between the male and female sample Z test was applied, that is
Z=x1-x2/√ (SD1) x2/N1+ (SD2) x2/N2
Z=60-65/√ (19.34) x2/376+ (18.70) x2/221
Z=-5/√.99+1.58
Z= -3.11
(Table value of Z at 0.05 level of significance is equal to 1.96)
Calculated value (C.V)<1.96
-3.11<1.96
So difference is insignificant.
It means that the attitude of both male and female shows that the women was not empower in the said era.
4.5 Analysis of Scale Factors (Factor-Matrix)
The attitude scale was divided in three factors i.e. Political Empowerment, Economic Empowerment and Social Empowerment. In the data early 13 questions were self explanatory and from the question 14 to 45 were about the women empowerment specific. So the factor analysis is from the 14 to 45 statement to get the proper results about the empowerment.
F1: Political Empowerment (Statement 14, 15, 16, 17, 18, 19, 44) = 7
F2: Economic Empowerment (Statement 20, 21, 22, 23, 24, 25, 29, 30) = 8
F3: Social Empowerment (Statement 26, 27, 28, 31, 32, 33, 34, 35, 36, 37, 38, 39, 40,
41, 42, 43, 45) = 17
Appendix D is Factors wise score of participants on scale.
Table 4.35 Inter correlation coefficients regarding Scores on scale factor
|
Factors |
Political Empowerment of women (F1) |
Economic Empowerment of women (F2) |
Social Empowerment of women (F3) |
|
F1 |
1 |
|
|
|
F2 |
0.64 |
1 |
|
|
F3 |
0.52 |
0.59 |
1 |
Coefficient of correlation among all factors has high positive value because it is more than 0.50, which shows that all factors in the Scale were associated and correlated with one another. It also determines the internal consistency and validity of the scale.
4.6Participation of Women in National Elections (1988-2000)
In the period 1988 to 2000 four national elections were held in 1988, 1990, 1993 and 1997. The data of all these election were gathered and analyze. In this data the election procedures, number of candidates participated in each constituency was gathered. The number of female candidates and their names were also obtained and the winning candidates and their names were assembled. Then it was separated by the male and female representation on general seats so that the participation of women in general election could be calculated to assess the political empowerment.
|
Election Year |
Total Candidates |
Male Candidates |
Female Candidates |
Female Won |
Percentage of Women Participation |
|
1988 |
1334 |
1315 |
19 |
8 |
1.42 |
|
1990 |
1285 |
1273 |
12 |
2 |
0.93 |
|
1993 |
1396 |
1328 |
14 |
4 |
1.00 |
|
1997 |
1692 |
1671 |
21 |
7 |
1.24 |
Table 4.50 shows that in the general election 1988 the participation of women was highest in these four elections and it was 1.42%. General elections of 1988 were held after a long martial law and Pakistan Peoples Party participated in these elections after a long struggle. Benazir Bhutto was leading the election campaign of Pakistan Peoples Party and being a woman, it was a motivation for women of the country. So on general seats women participation against men was more than other three elections. In 1990 the participation of women was lowest in the three elections and that was 0.93. Less than 1% women participated in this election on general seats. Benazir Bhutto’s struggle was precious and the women endorsed it but her government was dismissed and the hopes with her were also damaged. So the participation of women shows the political interest in the women and their sense of lowered hopes. In the election 1993, the ratio of women participation on general seats increased and it reach to 1.00 %. Although it was not a drastic change but little improvement was there. In the election 1997, the situation got improved and the women participation was increased to 1.24 %. But when saw the winning women candidates; it reflects that the political legacy and the resources played a vital role. There was no female candidate from among common people who won on general seats. Although the victory is not important in the women empowerment and the participation of women is more important and it was less than 1.50 % in all four elections of this era. The complete picture shows the poor situation of women empowerment, even in the presence of two time women Prime Minister in the country.
Figure 4.46 women participation in election 1988-2000 on general seats
Fig. 4.46 shows that the trend of women participation on general seats in the elections of said era is negative. There is less participation of women in all three elections 1990, 1993 and 1997 with the comparison of 1988 elections. Although the participation in 1988 is also not encouraging and the share of women is very low but the negative trend in future shows the worse situation and very low political empowerment.
Table 4.37 Reserved Seats for Women in National Elections in the period of 1988-2000
|
Year of Election |
General Seats |
Reserved Seats for Women |
Reserved Seats for Non Muslims |
Total Seats |
|
1988 |
207 |
20 |
10 |
237 |
|
1990 |
207 |
0 |
10 |
217 |
|
1993 |
207 |
0 |
10 |
217 |
|
1997 |
207 |
0 |
10 |
217 |
Here the reserved seats of women in National Assembly are also important. These reserved seats played equity role. Where there is less equality and we are not getting it due to some constraints, the way out is equity. In Pakistan government make strategy of reserved seats of women to make better representation of women in the Assembly. But in this era, in four elections in the field of reserved seats, the situation was not encouraging. In the election of 1988, there were 20 reserved seats for women, but later these seats were abolished and in the elections of 1990, 1993 and 1997 there were no reserved seats of women and these were restored in the next elections in 2002, after the era under consideration. When we see the women representation in the national assembly the situation is bad. There was low women representation in these elections and very few women members were there in the National Assembly. This situation reduced the voice of women in the Assembly and it also affected legislation in the favour of women.
Figure 4.47 Reserved seats of women in elections 1988-2000
Figure 4.47 shows the total negative trend in women reserved seats in the general election in the era of 1988-2000. This shows the political empowerment of women was very low in this era and it had also a negative effect on the legislation for women rights.
In the data collected for general elections of 1988, 1990, 1993 and 1997 possibility of elaborating the situation of political empowerment on the basis of provinces was also explored. The data were obtained for the provinces and the federal capital, Islamabad. Total numbers of candidates, male, female, and the female candidates who won the elections was separated, their percentages and comparison with each other was calculated. Correlation between the provinces was found out and the situation of women empowerment in whole of the country was worked out.
Table 4.38 Participation of women in election 1988, province wise
|
Province or area |
Total Candidates |
Male Candidates |
Female Candidates |
Female Won |
Percentage of Women Participation |
|
NWFP (KPK) |
289 |
284 |
5 |
1 |
1.73 |
|
Punjab |
601 |
592 |
9 |
3 |
1.49 |
|
Sindh |
333 |
328 |
5 |
4 |
1.50 |
|
Balochistan |
97 |
97 |
0 |
0 |
0 |
|
Islamabad |
14 |
14 |
0 |
0 |
0 |
In the election of 1988, women participation on general seats was higher in the NWFP (KPK) than that of other provinces. Women participation in this election in NWFP (KPK) was 1.73 percent, the women participation in Punjab province were 1.49%, in Sindh 1.50% and in Baluchistan and Islamabad the women participation was 0%. The literacy rate did not contribute for the political participation and even in Islamabad, there was no female candidate on the general seat.
Table 4.52 shows that number of female candidates on general seats in Punjab was higher than that of other provinces, but when we calculate it with the total number of candidates and with the male candidates, the percentage is lower than the NWFP (now KPK)and Sindh. Although in Baluchistan and Islamabad the situation was worse.
Table 4.39 Participation of women in election 1990, province wise
|
Province or are |
Total Candidates |
Male Candidates |
Female Candidates |
Female Won |
Percentage of Women Participation |
|
NWFP (KPK) |
203 |
201 |
2 |
0 |
0.98 |
|
Punjab |
652 |
646 |
6 |
0 |
0.92 |
|
Sindh |
333 |
329 |
4 |
2 |
1.20 |
|
Balochistan |
84 |
84 |
0 |
0 |
0 |
|
Islamabad |
13 |
13 |
0 |
0 |
0 |
The women participation in the 1990 election was also less than the 1988 elections. Table 4.54 shows that in this election the women participation on general seats was little higher in Sindh Province compared to other provinces and in Islamabad. In this election the women participation in Sindh was 1.20%, in NWFP (now KPK) was0.98% and in Punjab this was only 0.92%. In Baluchistan and Federal Capital Islamabad the women participation on general seats was 0%. It shows the women political empowerment was not good in this election. The trend in women political empowerment was also towards decline. In this election 6 female candidates were in Punjab which was the higher number than any other area, but the ratio in comparison to other provinces was lower than that of Sindh and NWFP(now KPK).
Table 4.40 Participation of women in election 1993, province wise
|
Province or area |
Total Candidates |
Male Candidates |
Female Candidates |
Female Won |
Percentage of Women Participation |
|
NWFP (KPK) |
234 |
233 |
1 |
0 |
0 |
|
Punjab |
595 |
589 |
6 |
2 |
1.00 |
|
Sindh |
463 |
358 |
5 |
2 |
1.07 |
|
Baluchistan |
93 |
92 |
1 |
0 |
1.07 |
|
Islamabad |
11 |
10 |
1 |
0 |
9.09 |
In the1993 elections, the situation was not better. Table 4.54 shows that in Punjab there were 6 female candidates and in Sindh there were 5 female candidates and in other three provinces and federal capital there were one female candidate in each area on general seats. But the ratio was high in Islamabad, in Sindh and Baluchistan the ratio was equal and it was 1.07. But in Baluchistan the ratio was 0%. But the positive thing in this election was that, there were female candidates in all areas. The participation of women in this election was little better than the election of 1990 and the comparison of these two elections shows positive trend.
Table 4.41 Participation of women in election 1997, province wise
|
Province or are |
Total Candidates |
Male Candidates |
Female Candidates |
Female Won |
Percentage of Women Participation |
|
NWFP (KPK) |
454 |
450 |
3 |
0 |
0.66 |
|
Punjab |
703 |
694 |
9 |
3 |
1.28 |
|
Sindh |
435 |
426 |
9 |
4 |
2.06 |
|
Baluchistan |
95 |
95 |
0 |
0 |
0 |
|
Islamabad |
5 |
5 |
0 |
0 |
0 |
In the 1997 elections, there was no visible change in female participation in general elections, but there was a little improvement. In Sindh and Punjab provinces there were 9 candidates in each province on general seats. In NWFP(now KPK)three female candidates contested on general seats, but no female candidate contested in Islamabad. The ratio of female candidates was higher in Sindh province, it was 2.06%, in Punjab it was 1.28% and in NWFP (now KPK) this ratio was 0.66%. In Baluchistan and federal capital the percentage was 0. However, out of 21 female candidates, 7 won (4 from Sindh and 3 from Punjab). So the winning ratio of female candidates was good but the female participation on general seats was not sufficient to the sample.
4.7 Educational Empowerment of Women (1988-2000)
Table 4.42 Number of schools by sex in 1988-2000
|
Year |
Primary Sch.Total |
Female Prim.School |
Middle Sch. Total |
Female Mid. School |
High SchoolTotal |
Fem. High School |
|
1988-89 |
103700 |
27400 |
7800 |
2900 |
6600 |
1800 |
|
1989-90 |
110500 |
30000 |
8100 |
3100 |
7200 |
1900 |
|
1990-91 |
114100 |
31100 |
8700 |
3400 |
8200 |
2100 |
|
1991-92 |
112400 |
31600 |
9000 |
3500 |
8400 |
2100 |
|
1992-93 |
130600 |
38100 |
11800 |
5100 |
8700 |
2700 |
|
1993-94 |
130100 |
40000 |
12100 |
5200 |
9200 |
2900 |
|
1994-95 |
139600 |
42000 |
12600 |
5600 |
9500 |
3100 |
|
1995-96 |
143100 |
43400 |
13300 |
5700 |
9500 |
3100 |
|
1996-97 |
149600 |
42000 |
14500 |
5800 |
9900 |
3200 |
|
1997-98 |
156300 |
51200 |
17400 |
7200 |
11100 |
3800 |
|
1998-99 |
159300 |
56500 |
18100 |
8000 |
12400 |
4500 |
|
1999-2000 |
162500 |
58700 |
18400 |
8100 |
12600 |
4600 |
Table 4.46 shows big difference between the male and female schools in Pakistan. Although the share of women in the sample is equal to men but when we see the picture of education sector the budgetary expenditure on female institutions is almost half that for the male. In 1988-2000 the total primary schools in Pakistan were 103,700 in which the female institutions were 27,400 i.e., 26.42% of the total number of schools. In 1999-2000 the total primary schools in Pakistan were 162,500 in which female schools were 58,700, i.e., 36.12% of the total schools. Almost 9.7% female primary schools were increased compared to male schools.
Figure 4.48 Share of female Primary Schools in Total
Fig. 4.48 shows the difference between the male and female primary schools. In spite of increased number of female primary schools the male primary schools were twice those of female schools.
Figure 4.49 Shares of Female Middle Schools in Total
Figure 4.49 also shows almost the same situation and the equal opportunity for female in middle school education seemed for away. In 1988-89 the total middle schools in Pakistan were 7,800 in which female middle schools were 2,900, i.e., female middle schools were 37.17% of the total schools. In 1999-2000 the total number of middle schools was 18,400 in which female middle schools were 8,100 (44.02 % of the total schools). In this decade the average ratio for female middle schools was raised by 6.85 but the total numbers of female schools were still less than 7% with respect to the sample.
Figure 4.50 Shares of female high schools in total
Figure 4.50 shows that in 1988-90 the total number of high schools in Pakistan were 6,600 in which the female high schools were 1,800. It means that female schools were 27.27% and male schools were 72.73% and there was marked difference. In 1999-2000 the number of total high schools was raised to 12,600 in which the female high schools were 4,600, which was 36.50% of the total high schools. This shows that in female high schools there was increase of 9.23%, but when we see the figures in numbers, there was still a big difference between the male and female high schools with the respect to the almost equal sample of male and female.
Table 4.43 Number of Colleges and Universities in 1988-2000
|
Year |
Arts & Sc. Colleges Total |
Female Arts & Sc. Colleges |
Profess. Colleges Total |
FemaleProfess. Colleges |
Universities Total |
Female Universities |
|
1990-91 |
612 |
222 |
99 |
8 |
22 |
0 |
|
1991-92 |
633 |
233 |
139 |
9 |
23 |
0 |
|
1992-93 |
649 |
243 |
147 |
9 |
23 |
0 |
|
1993-94 |
651 |
248 |
165 |
10 |
25 |
0 |
|
1994-95 |
678 |
257 |
167 |
10 |
25 |
0 |
|
1995-96 |
715 |
276 |
260 |
16 |
25 |
0 |
|
1996-97 |
737 |
287 |
264 |
16 |
25 |
0 |
|
1997-98 |
787 |
309 |
293 |
19 |
26 |
1 |
|
1998-99 |
840 |
339 |
308 |
18 |
26 |
1 |
|
1999-2000 |
889 |
358 |
324 |
15 |
26 |
1 |
Table 4.57 also shows big disparity in the male and female education in Pakistan. Although there was a little improvement during this decade but the gender equality was missing in higher education sector during 1988-2000.
Figure 4.51 Share of female arts and science colleges in total
Figure 4.51 shows that in 1990 the total number of Arts and Science Colleges in Pakistan were 612 in which female colleges were only 222 (i.e., 36.27% of the total). In 1999-2000 the total number of Arts and Science Colleges increased to 889 in which the female colleges were 358, which were the 40.26%. Thus, the increase of female colleges was 3.99% but in figures the gender disparity was there.
Figure 4.52 Shares of female professional colleges in total
Figure 4.52 is showing big disparity in female and male professional colleges. In 1990 there were 99 professional colleges in Pakistan in which 8 colleges were for females. It means that female colleges were 8.08% of the total colleges. In 1999-2000 the numbers of colleges was increased to 324, among those 15 were for female. At that time there were 4.62% of the colleges for women. It means that the ratio of female colleges decreased during this decade gradually and it became 3.46%. Here it is important that a move for co-education was started and females were also studying in the male colleges, so the government was not opening further female colleges.
Figure 4.53 Share of female universities in total
Figure 4.53 shows big difference in number of male and female universities. There was no female university in Pakistan till 1997 and then a single university was opened. In 1990 there were 22 universities in Pakistan and no female university. In 2000, out of a total of 26 public sector universities there was only one for females. During this decade, there was no big development in set up of universities, however, a separate female university was established. The disparity in this sector appears large, but in actual practice female students are also studying in all the universities and there is co-education. Thus, need of separate female universities is not as that in other levels of education.
The situation of educational institutions and the share of females in these is not encouraging and in the specified era a big disparity was visible. However, the sex-wise enrolment will show the real share of female education in Pakistan.
Table 4.44 Enrolment at school level by sex
|
Year |
Enrolment in Primary Sch.Total |
Enrolment in Female Prim.School |
Enrolment in Middle Sch. Total |
Enrolment in Female Mid. School |
Enrolment in High SchoolTotal |
Enrolment in Fem. High Sch. |
|
1990-91 |
10837000 |
3675000 |
2821000 |
842000 |
1004000 |
285000 |
|
1991-92 |
10736000 |
3714000 |
2981000 |
858000 |
1079000 |
295000 |
|
1992-93 |
12726000 |
4596000 |
3040000 |
994000 |
1168000 |
357000 |
|
1993-94 |
13288000 |
5055000 |
3305000 |
1123000 |
1315000 |
421000 |
|
1994-95 |
14264000 |
5638000 |
3816000 |
1347000 |
1525000 |
514000 |
|
1995-96 |
14527000 |
5702000 |
3605000 |
1270000 |
1447000 |
480000 |
|
1996-97 |
15395000 |
6156000 |
3726000 |
1357000 |
1521000 |
520000 |
|
1997-98 |
17063000 |
6997000 |
4032000 |
1532000 |
1658000 |
605000 |
|
1998-99 |
18169000 |
6450000 |
4098000 |
1586000 |
1702000 |
638000 |
|
1999-2000 |
19148000 |
7044000 |
4112000 |
1615000 |
1726000 |
653000 |
Table 4.58 shows that the enrolment of women in educational institutions was lower than that of men. Even in the year 2000 the male enrolments in primary schools was 19,148,000 and female enrolments was 7,044,000, which was 36.78% of the total enrolment with the male enrolment of 63.21%. Enrolment in the middle schools and high schools show almost the same situation and male enrolment was twice that of female
Figure 4.54 Female enrolment in primary schools
Figure 4.54 shows that the total enrolments in the primary schools during this decade had up word trend but the female enrolments was not following the pace. In 1990, total enrolment in primary schools in Pakistan was 10,837,000 in which the female enrolment was 3,675,000, (63.21% male and 36.79% female). In 1999-2000 the total enrolment in primary schools was raised to 19,148,000, in which female enrolment was 7,044,000. It means that the female enrolment was 36.78% and there was no big change in the ratio of male and female enrolments. In 1990 the female enrolment was 36.79% and after one decade the female enrolment was 36.78%. So there was no significant change in female enrolment ratio during this decade
Figure 4.55 Female enrolments in middle schools
Figure 4.55 shows that in 1990 the total enrolments in middle schools in Pakistan 2821000 in which the female enrolment was 842000. It means at that time 29.84% female and 70.15% male were enrolled in middle schools. In 2000 the total enrolment was raised to 4112000 in which 1615000 were female. It means at that time the female enrolment was raised to 39.27% and this raise was 9.43%. In spite of this raise the big difference of female and male enrolments was there.
Figure 4.56 Female enrolments in high schools
Figure 4.56 shows that in 1990 enrolment in high schools was 1,004,000 in Pakistan of which the female enrolment was 285,000, (28.38% of the total enrolment). In 2000 the total enrolment in high schools was 1726000, in which female enrolment was 653,000 and it was 37.83% of the total. This figure shows a rise of 9.45% in female enrolment during the decade but the gender disparity was still there and a huge difference between male and female enrolments was observed.
Table 4.45 Enrolment in colleges and universities
|
Year |
Enrolments in Arts & Sc. Colleges Total |
Enrolments in Female Arts & Sc. Colleges |
Enrolments in Profess. Colleges Total |
Enrolments of Femalein Profess. Colleges |
Enrolments in Universities Total |
Enrolment of Female in Universities |
|
1990-91 |
630000 |
211000 |
75786 |
18902 |
61857 |
11667 |
|
1991-92 |
679000 |
232000 |
76249 |
19003 |
65944 |
12727 |
|
1992-93 |
703000 |
251000 |
76726 |
19125 |
68301 |
14856 |
|
1993-94 |
675000 |
249000 |
99197 |
25704 |
77119 |
19342 |
|
1994-95 |
704000 |
276000 |
100969 |
27715 |
80651 |
21174 |
|
1995-96 |
734000 |
299000 |
128621 |
33403 |
82955 |
23105 |
|
1996-97 |
762000 |
319000 |
140503 |
36082 |
91883 |
25050 |
|
1997-98 |
796000 |
335000 |
162239 |
40659 |
93780 |
24848 |
|
1998-99 |
780000 |
351000 |
163445 |
41078 |
91635 |
25469 |
|
1999-2000 |
792000 |
372000 |
160985 |
41036 |
114010 |
27369 |
Table 4.59 shows enrolments of male and female in colleges and universities and it shows the participation of women in higher education. The picture was not good and was almost same as at the school level.
Figure 4.57 Female enrolments in arts and science colleges
Figure 4.57 shows that in 1990 the total enrolment in Arts and Science College in Pakistan was 630,000 in which the female enrolment was 211,000, (33.49% of the total enrolment). In 2000 the enrolment in colleges increased to 792,000 in which the female enrolment was 372,000, which was 46.96% of the total enrolment. This shows two important things, one more interest of women in higher education as the disparity in 2000 was little less than in the 1990, second in this decade the enrolment of women rose to 13.47%.
Figure 4.58 Female enrolments in professional colleges
Figure 4.58 shows that in 1990 total enrolment in professional colleges in Pakistan was 75,786 among which 18,902 were female. It means that 24.94% of the total enrolment was female. In 2000 the total enrolment in professional colleges was 160,985 in which 91,036 were female. The percentage of female in the professional colleges was 25.49% that means in one decade the enrolment of female was increased by .55%. It shows that the improvement was negligible. When we see the picture in numbers, it shows the participation of women was one fourth of the male enrolments. So the gender disparity was there and the government seemed to fail to reduce the gender gap.
Figure 4.59 Female enrolments in universities
Figure 4.59 shows enrolment of male and female students in the universities. It shows also a gap between the male and female enrolment. In 1990 total enrolment in the universities was 61,857 in which the enrolment of female was 11,667. It means that the enrolment of female in universities was 18.86% and the enrolment of male was 81.14%. There was a sizable gender gap in the university education. In 2000 the enrolment in the universities rose to 114,010 in which the female enrolment was 27,369. At this time the female enrolments was 24% and the male enrolment was 76%. In one decade the enrolment of female rose by 5.14% but still there was a big gender disparity as the women were almost one fourth of the men.
Table 4.46 Strength of female teachers at school level
|
Year |
Total Teachers in Primary Sch. |
Female Teachers in Prim.School |
Total Teachers in Middle Sch. |
Female Teachers in Mid. School |
Total Teachers in High School |
Fem. Teach. in High Sch. |
|
1990-91 |
277800 |
92700 |
84100 |
32000 |
152500 |
43900 |
|
1991-92 |
293500 |
94900 |
87500 |
33700 |
157000 |
45600 |
|
1992-93 |
299000 |
96300 |
71800 |
31800 |
123600 |
38200 |
|
1993-94 |
322000 |
109600 |
80400 |
39900 |
170800 |
55300 |
|
1994-95 |
334000 |
114500 |
86400 |
38400 |
175800 |
65700 |
|
1995-96 |
331000 |
109300 |
94300 |
37800 |
160000 |
48800 |
|
1996-97 |
322900 |
111800 |
84700 |
38900 |
160700 |
53100 |
|
1997-98 |
339900 |
120500 |
88500 |
42700 |
181800 |
62200 |
|
1998-99 |
359200 |
124700 |
89700 |
43400 |
152700 |
51200 |
|
1999-2000 |
366400 |
127200 |
91500 |
44300 |
155700 |
52200 |
Table 4.60 shows the total number of teachers and female teachers in school, college and university levels. The ratio of the presence of women in educational institutions shows the women empowerment.
Figure 4.60 Female Teachers in primary schools
Figure 4.60 shows that in 1990 total school teachers in primary schools were 277,800 in which 92,700 were female. Female teachers were 33.36% and male teachers were 66.64% in primary schools. In 2000 the numbers of total teachers in primary schools were 366,400 in which 127,200 were female teachers. At this time female teachers were 34.71% and male teachers were 65.29%. It means that total increase in teachers was 75.81% but in female teacher the increased ratio was 1.35%. It shows that the numbers of teachers were increasing rapidly during this decade but the gender gap was there and there was no significant increase in female teachers. The graphic lines of the figure also showing poor situation of women share in primary teaching sector.
Figure 4.61 Female teachers in middle schools
Figure 4.61 shows that in 1990 total numbers of teachers in middle schools were 84,100 in which 32,000 teachers were female. At that time female teachers were 38.04% and male teachers were 61.95%. In 2000 total numbers of schools teachers were raised to 91,500 in which female teachers were 44,300. After decade the female teachers in middle schools were 48.41% and the male teachers were 51.58%. So in middle schools the gender disparity was reduced the ratio of female teachers were raised by 10.37%. The figures in 2000 shows that women were getting proper share in the middle school teaching.
Figure 4.62 Female teachers in high schools
Figure 4.62 shows that in 1990 the total numbers of high school teachers were 152,500 in which 43,900 were female teachers. In this year the percentage of female teachers in high schools was 28.78 and the male were 71.22%. In 2000 the total numbers of teachers was 155,700 among which the female teachers were 52,200. After one decade the female teachers were 33.52% and male were 66.48%. Female teachers were increased by 4.74% while the total numbers of teachers were increased by 2.05%. In this decade the policy seemed that the focus was on female to increase their numbers in high schools.
Table 4.47 Strength of female teachers in colleges and universities
|
Year |
Total Teachers in Arts & Sc. Colleges |
Female Teachers inArts & Sc. Colleges |
Total Teachers in Profess. Colleges |
Female Teachers in Profess. Colleges |
Total Teachers in Universities |
Female Teachers in Universities |
|
1990-91 |
20792 |
7277 |
4544 |
907 |
4744 |
640 |
|
1991-92 |
20548 |
7447 |
4591 |
913 |
4926 |
674 |
|
1992-93 |
20672 |
7644 |
4520 |
927 |
5728 |
747 |
|
1993-94 |
21885 |
7945 |
6494 |
1381 |
5217 |
918 |
|
1994-95 |
22821 |
8159 |
6650 |
1364 |
5316 |
939 |
|
1995-96 |
24923 |
9142 |
7431 |
1529 |
5417 |
927 |
|
1996-97 |
24874 |
9151 |
7852 |
1574 |
5162 |
919 |
|
1997-98 |
27325 |
10262 |
7989 |
1639 |
5515 |
976 |
|
1998-99 |
26942 |
10347 |
8861 |
1771 |
4911 |
837 |
|
1999-2000 |
27662 |
10553 |
9043 |
1765 |
5914 |
1174 |
Table 4.61 shows the data of total teachers in general and professional colleges and in universities. This data also shows gender gap in the education sector and in teaching profession.
Figure 4.63 Female teachers in Arts and Science Colleges
Figure 4.63 shows that in 1990 the total number of teachers in arts and science colleges was 20,792 in which female teachers were 7,277. The percentage of female teachers in colleges was 34.99 and that of male teachers was 65. In 2000 the number of total teachers increased to 27,662 in which the female teachers were 10,553. At this time the female teachers were 38.14% and the male teachers were 61.86%. The female teachers were increased by 3.51% while the total teachers were increased to 24.83%. Here the gender gap still existed.
Figure 4.64 Female teachers in professional colleges
Figure 4.64 shows that total numbers of teachers in professional colleges were 4,544 in which 907 were female teachers. Thus the female teachers were 19.96% while the male teachers were 80.03%. This shows a big gender gap in the teachers of professional colleges. In 2000 the number of total teachers rose to 9,043 among which 1,765 were female. At this time females were 19.51% and male were 80.48%. This shows that the ratio of female teachers in professional colleges decreased by .45% while the total numbers of teachers increased by 49.75%. It means that in professional colleges the gender disparity was there and during the era under study, disparity increased.
Figure 4.65 Female teachers in universities
Figure 4.65 shows the total numbers of teachers in universities and the female teachers there in. In 1990, total teachers in universities of Pakistan were 4,744 in which the female teachers were 640. It means that the female teachers in universities were 13.40% while the male teachers were 86.60%. In 2000, the total teachers in universities were 5,914 and the female teachers 1,174. At this time the female teachers were 19.85% and the male teachers were 80.15%. Female teachers increased during the decade by 6.54% while the total numbers of teachers were increased by 19.78%. The gap between the male and female teachers continued.
What's Your Reaction?
 Like
0
 Dislike
0
 Love
0
 Funny
0
 Wow
0
 Sad
0
 Angry
0

Comments (0)